COLUMN - The graph below shows the performance of the different asset classes in the JSE over the past 12 months. It also shows returns of each asset class for different periods, including a one-, three- and five-year view.
JSE Asset Class Returns
ALSI – the JSE All Share Index consisting of all the companies on the stock exchange.
ALBI – the All Bond index that tracks movements in the South African bond market, usually made up of yield and capital price movement. This return is largely driven by SA government bonds.
SteFi – the short-term fixed interest index. What you would get in a fixed deposit account with a bank, although the indicator here was for 2022 when interest rates were much lower than they are today. Today a one-year fixed deposit would be sitting close to 8%.
ALPI – property index that tracks all JSE-listed property companies like Growthpoint, Stor-Age etc.

Looking at the one-year numbers, you would be forgiven for asking to stay in cash (STEFI – pink line). Much less stressful and [more] predictable than the volatile others, and you ended up with a return 1% higher than equities over the past year.
However, looking at the table and the longer five-year numbers, the averages start playing out, and we see the ALSI (equity investment) gave by far the highest return at 10,4% per annum over the past five years compared to bonds at 6,9%. That’s a big difference.
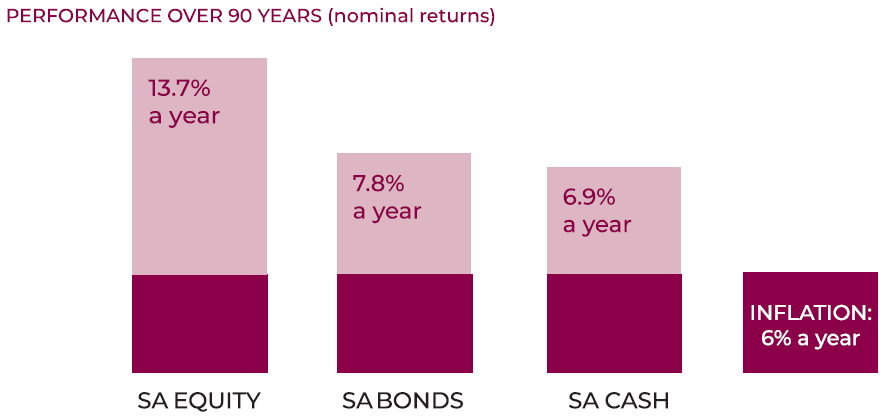
Sticking to the theme of asset class returns - the table below shows asset class returns over the past 90 years - clearly equities are the way to go over longer periods.
And looking back over the past five years, we see that even at 10,4% per annum, equities are still underperforming their long-term average.
This chart is a reminder of the importance of asset allocation, and making sure to invest in the asset class that matches your goals – if you need your funds in one year, then cash or bonds are likely the best place to invest. Up until three years, then a combination of all three asset classes will likely be the best. For five years and longer, investing in 100% equities is hands-down the best.
One of the biggest risks in investing is getting your asset allocation wrong. If your time frame is one year and you chase high returns, it is quite possible you are going to experience a large drawdown (look at the drawdowns in the one-year chart), get scared, and sell out while prices are low. In the Covid Crash of 2020, for example, markets pulled back 35% in two weeks. That was terrifying.
This is where making use of past data can be powerful. While we can’t use the past to predict the future, it does give us a framework to use in our decision-making. The graphic below is such a framework. It shows the frequency of negative returns for equity investments over different time periods.
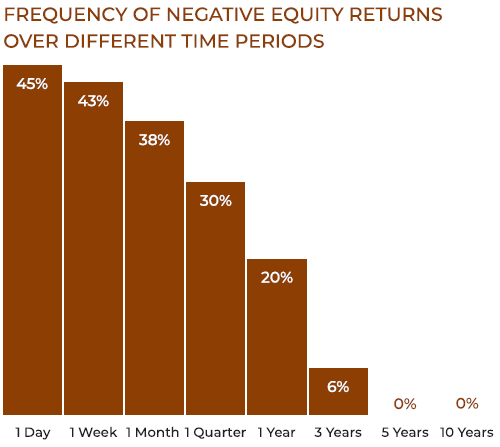
Over a one-day period, the probability of getting a negative return is 45%. That’s pretty high and akin to gambling if you want a one day ‘investment’. However, look how the frequency changes over time. After five years, the frequency of negative returns goes to 0%. In other words, there is actually very little risk of losing money if you invest in equity over a five-year period.
The market is a very powerful tool in growing our balance sheet. If we can get our asset allocation correct, we can minimise our risk of capital loss while targeting higher investment returns at the same time.

Matthew Matthee has a wealth management business that specialises in retirement planning and investments. He writes about financial markets, investments, and investor psychology. He holds a Masters Degree in Economics from Stellenbosch University and a Post Graduate Diploma in Financial Planning from UFS. [email protected]
‘We bring you the latest Garden Route, Hessequa, Karoo news’